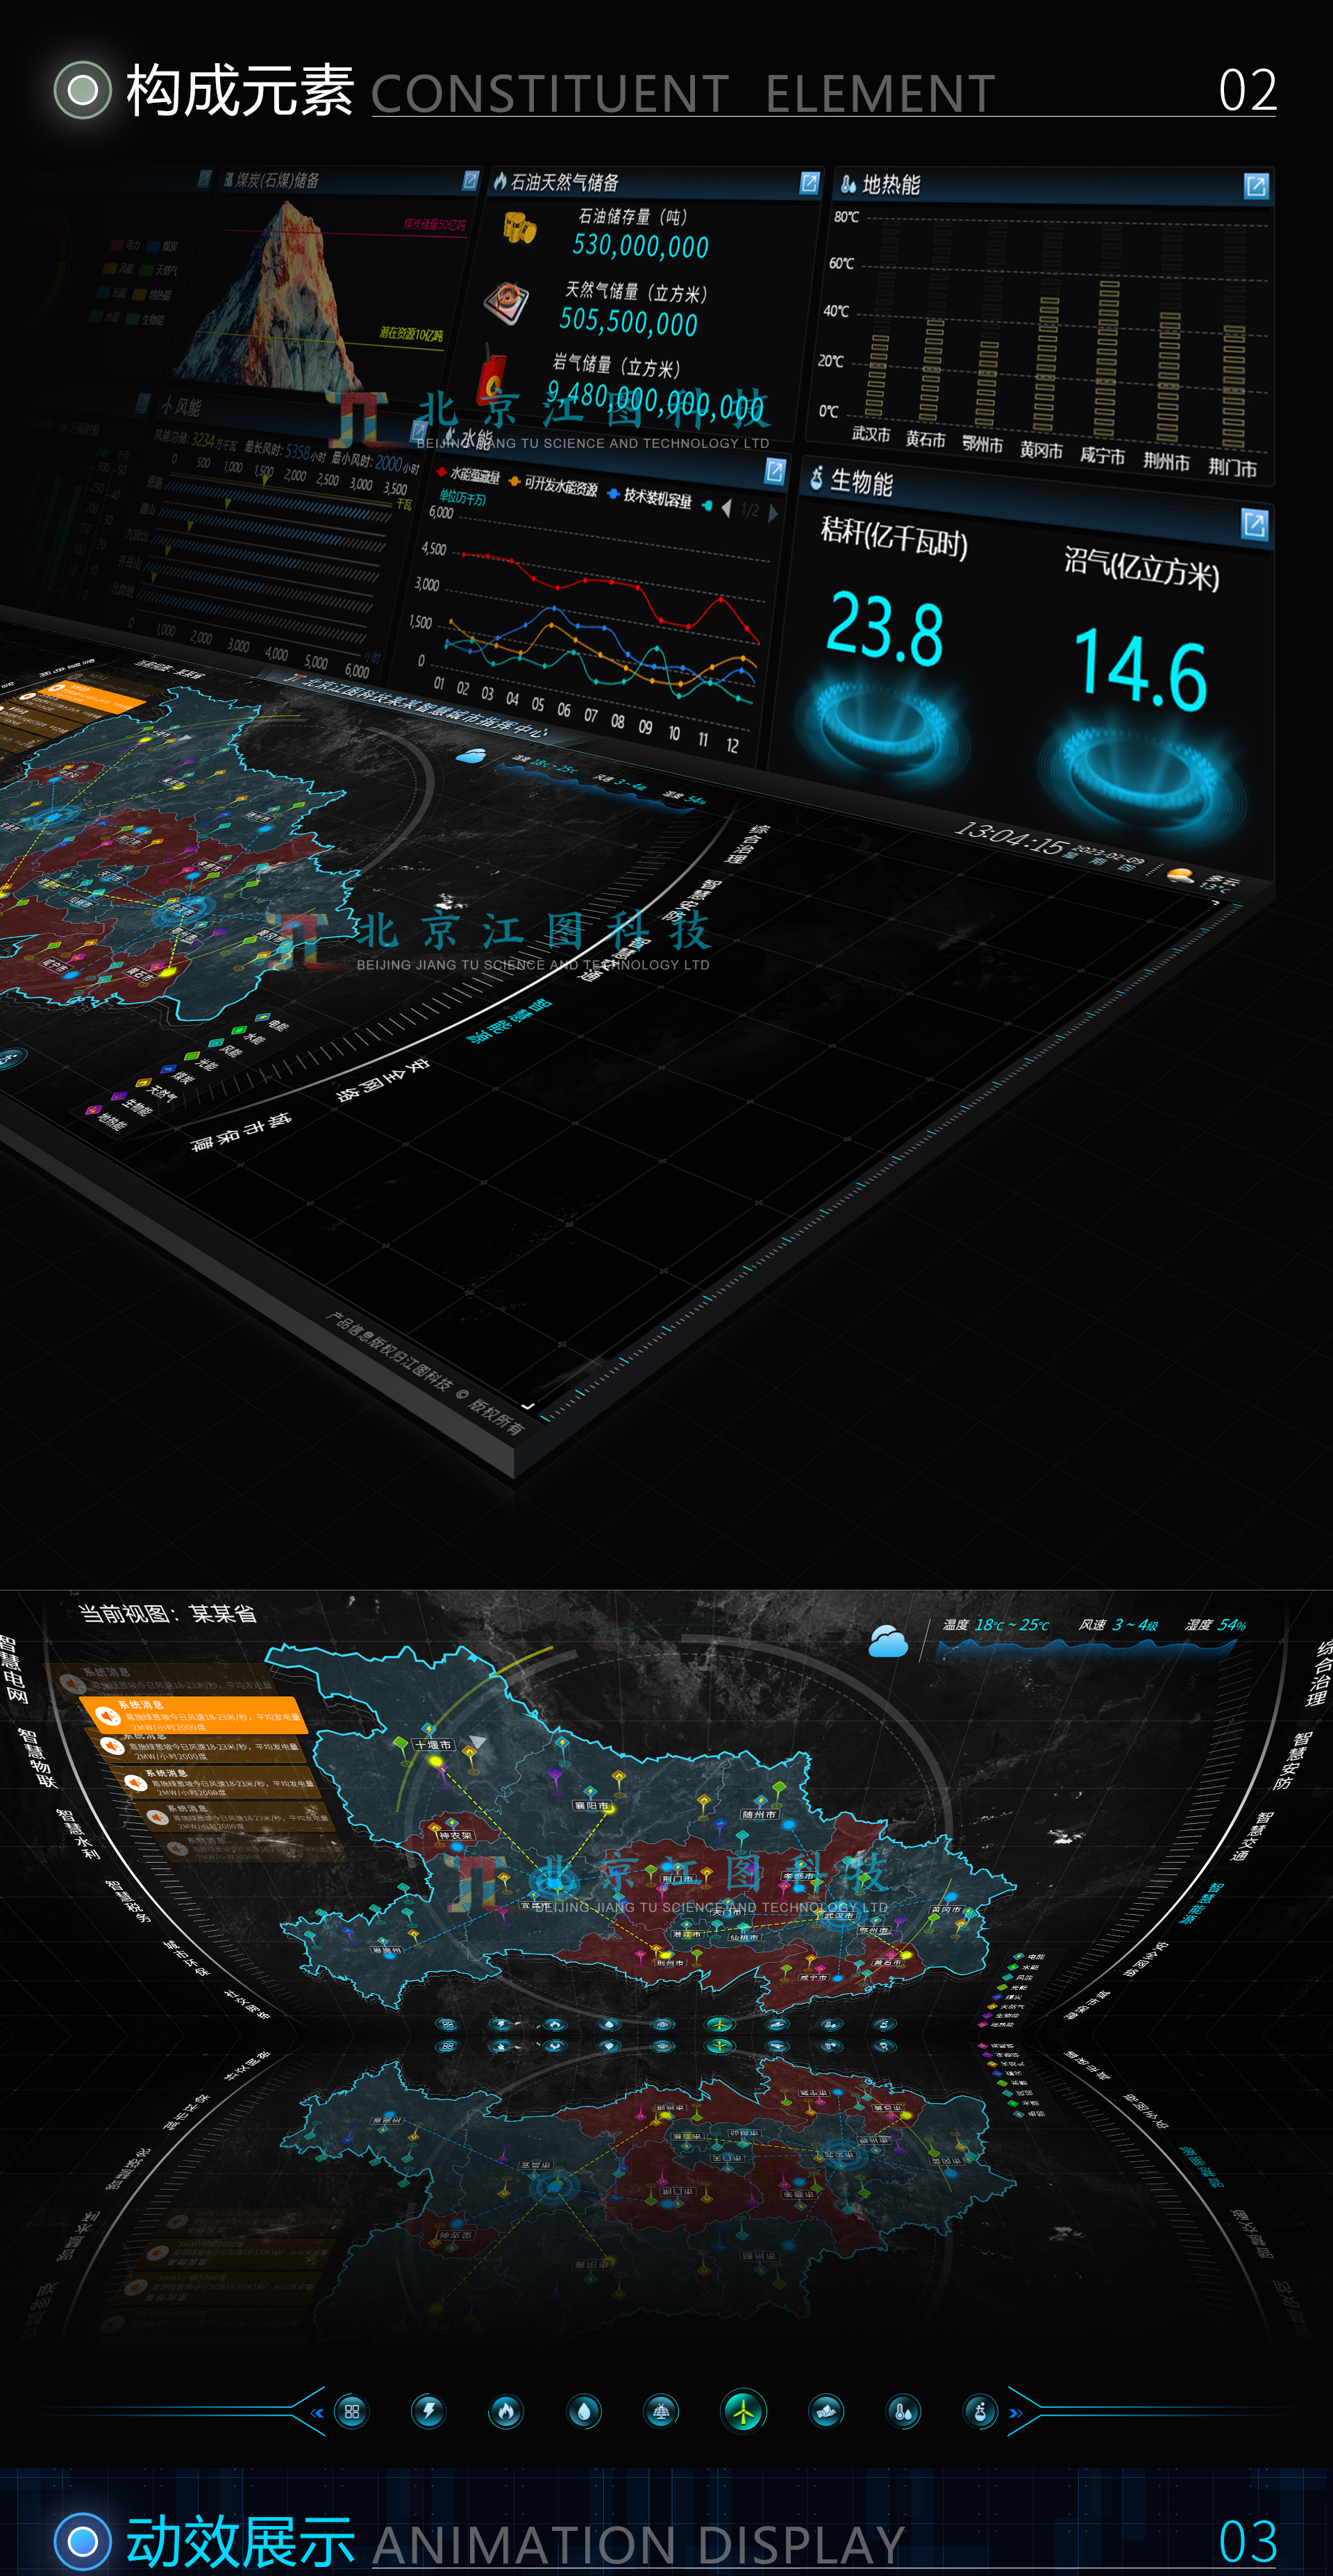
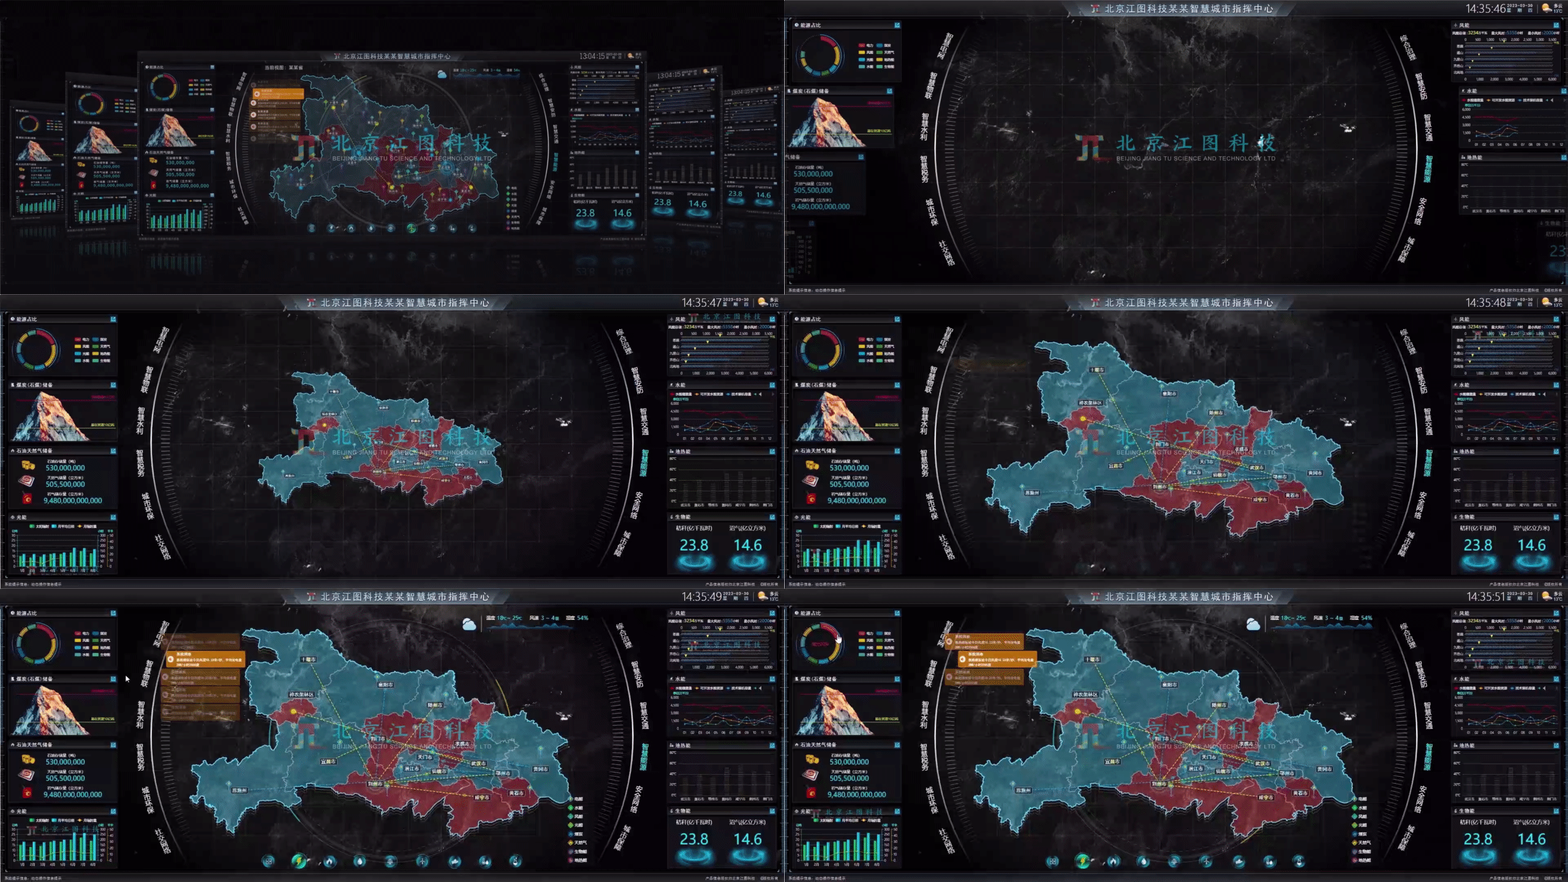
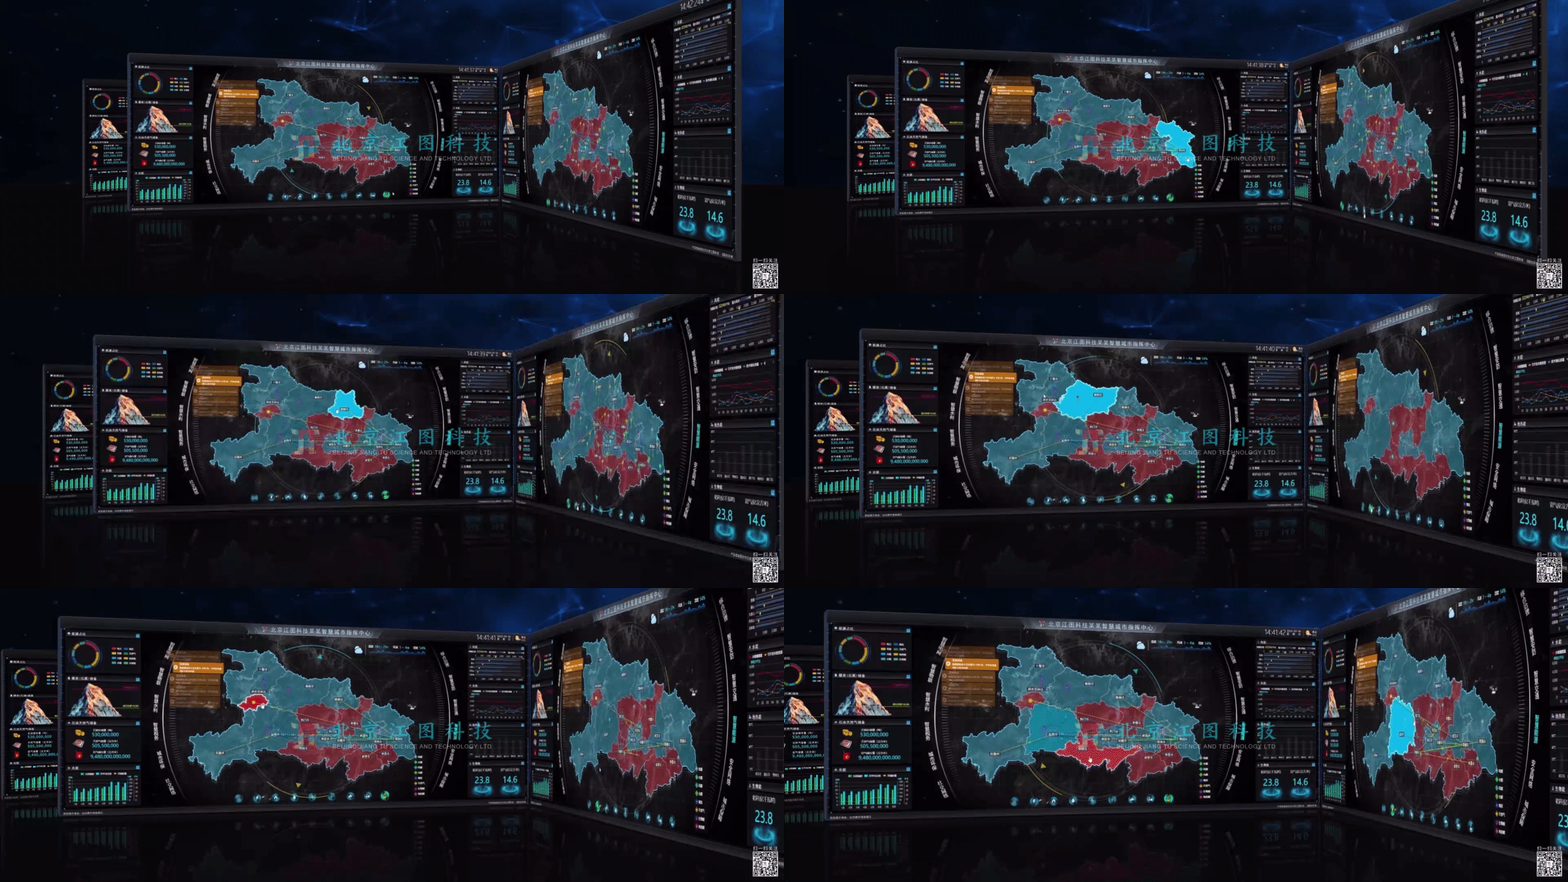
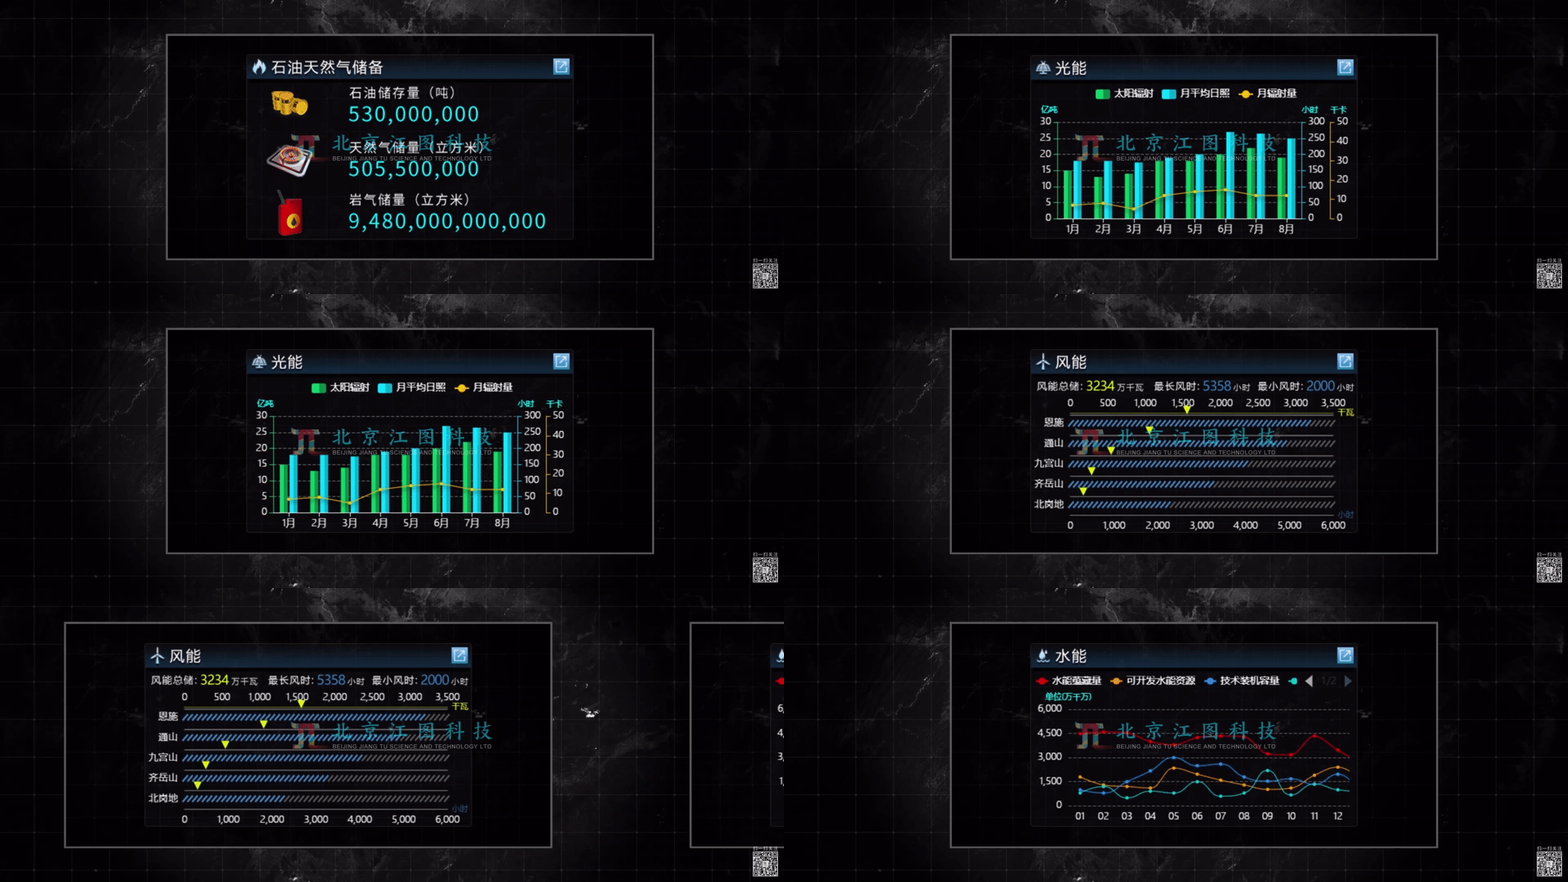
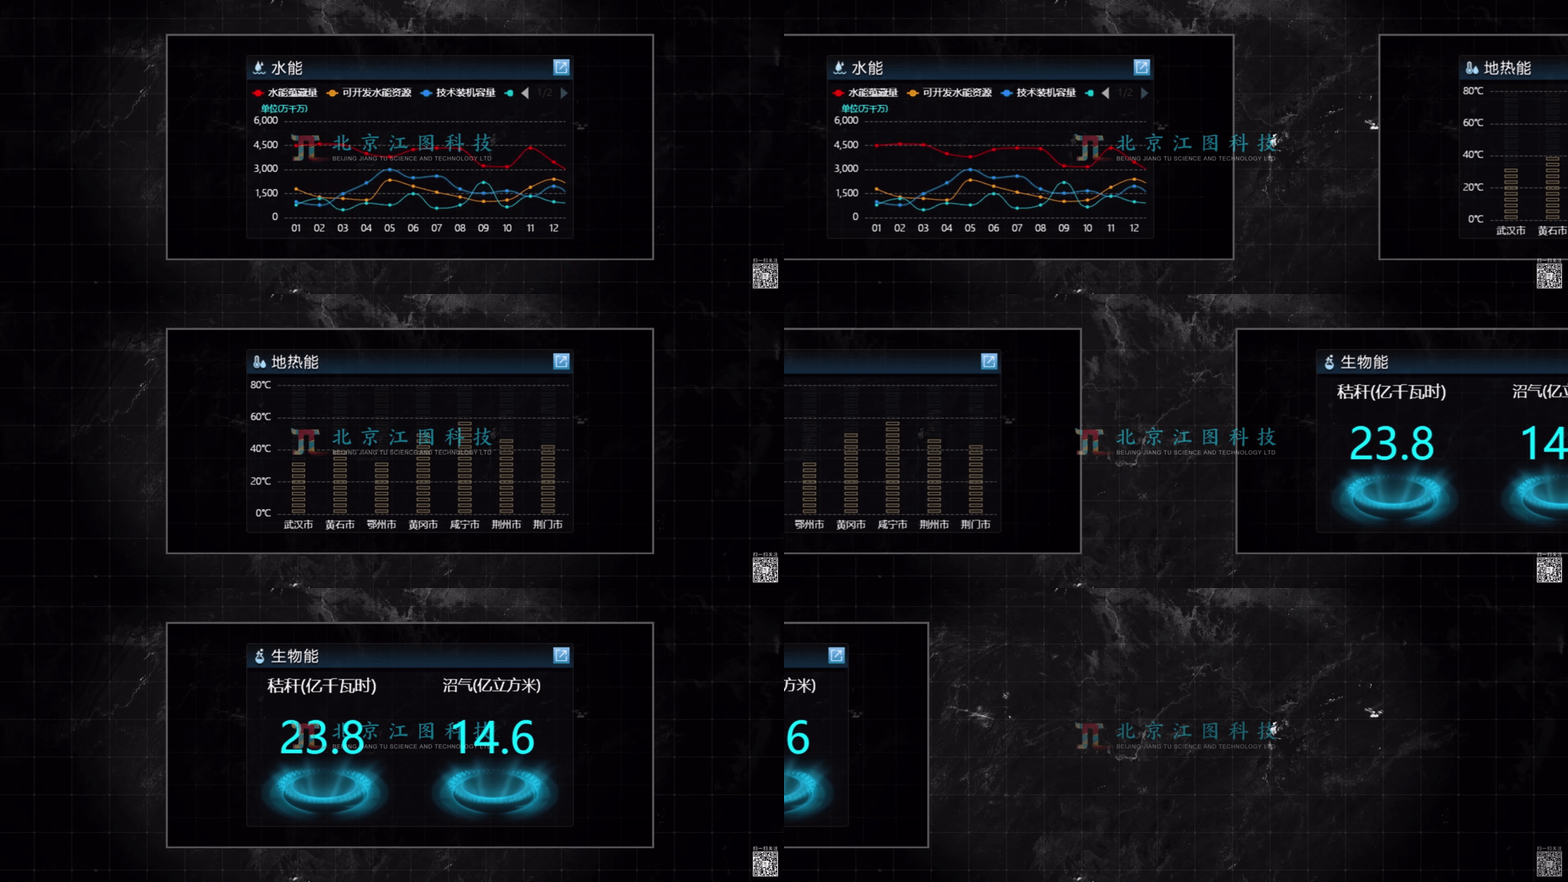
Smart energy visualization is an energy management method based on data analysis and visualization technology. Through real-time monitoring, collection and analysis of energy data, it transforms the data into visual charts, images and dynamic models, so as to more intuitively understand and optimize energy usage, so as to achieve efficient use and conservation of energy. Through the use of the Internet of Things, cloud computing, big data, artificial intelligence and other new-generation information technology applications to improve energy production, distribution, and use, to achieve optimal calculation of all links and the entire process of the energy system, and to carry out effective monitoring, management and control.






The copyright of this work belongs to 江图科技. No use is allowed without explicit permission from owner.

New user?Create an account
Log In Reset your password.
Account existed?Log In
Read and agree to the User Agreement Terms of Use.

Please enter your email to reset your password
The effect is good, the sense of science and technology is very strong.
very nice
looks good